A5 v1.0

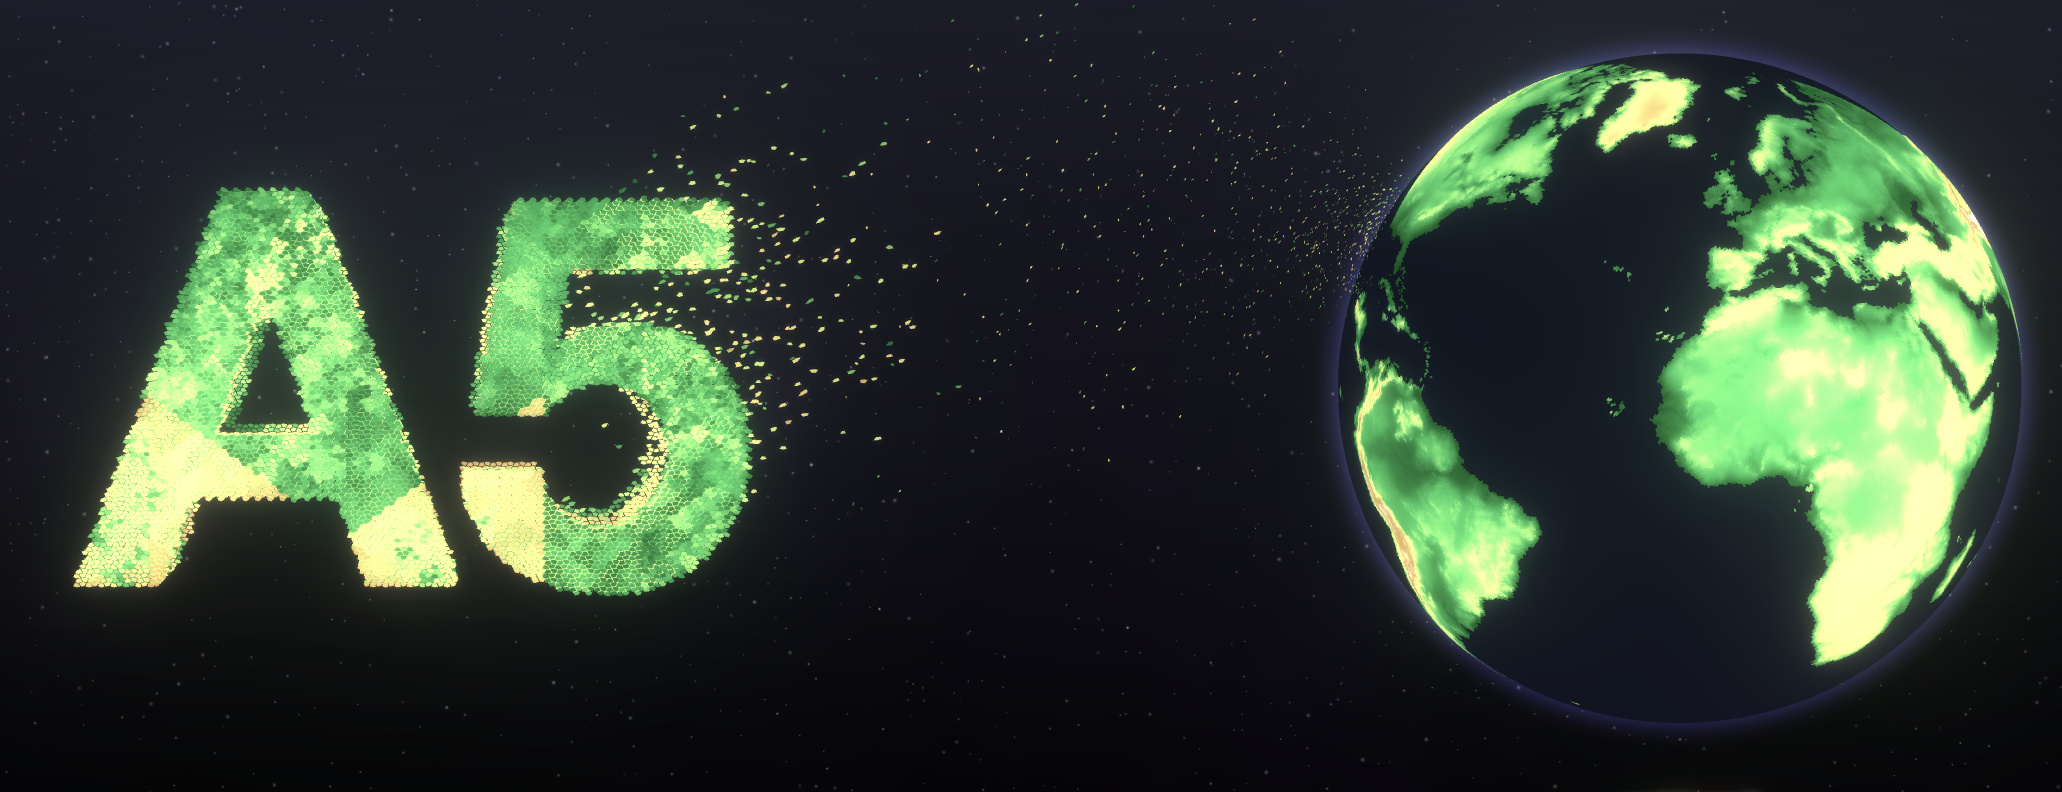
It has been 18 months since the first announcement of A5. What started off as an experiment in visualization (and an obsession with pentagons) has grown into a useful tool, with a wealth of libraries, tools and software building on top.
Today I'm excited to announce that the v1.0 version of A5 is out, bringing a powerful set of features and performance improvements as well as crystallizing the grid and index definition for the future.
If you're new to A5, in a nutshell it is a grid system that allows the representation of any position, line or polygon region on the globe as a pentagonal cell (or collection of cells), each represented as a compact 64-bit integer.
The industry term for this is a Discrete Global Grid System (DGGS), and there are already a number of other systems out there which are powering some of the world's largest companies and data analytics pipelines.
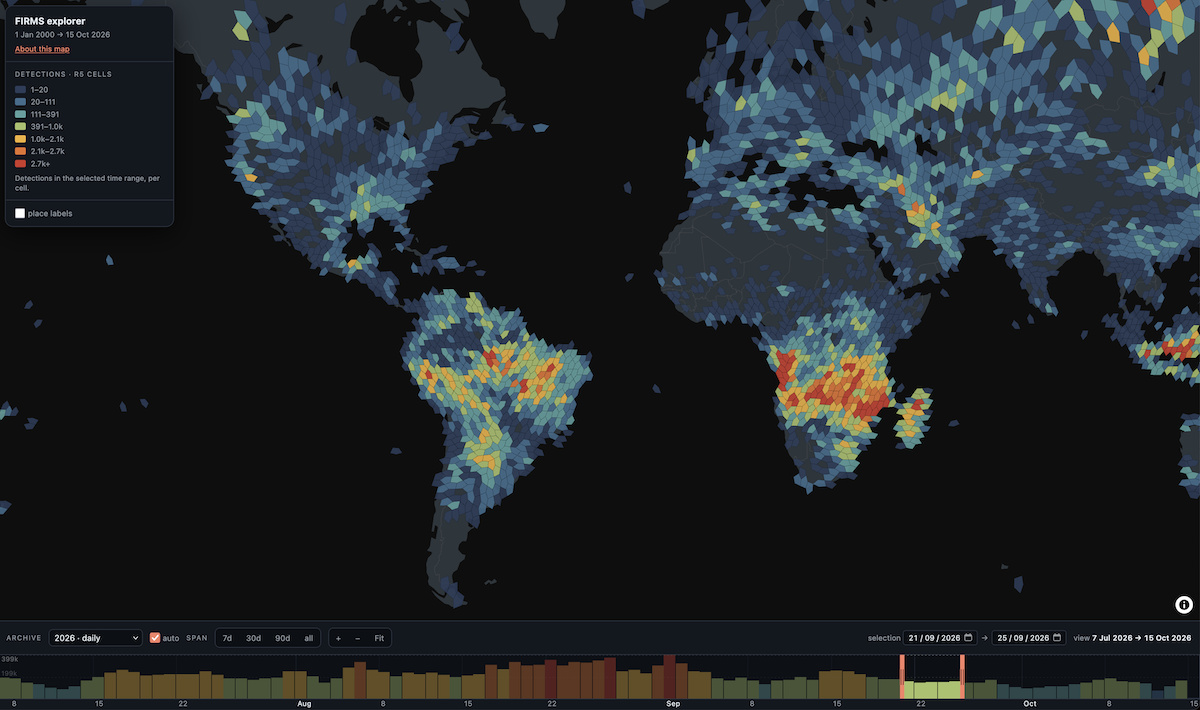
For a concrete example of an application leveraging A5, take a look at the FIRMS Explorer which uses A5 to aggregate 631 million fire detections worldwide since 2000.
Stable platform for the future
With v1.0 we are committing to keeping the grid layout and the cell IDs frozen going forward. While the system will evolve and grow, for example by adding more utility functions, the fundamentals will stay fixed so applications, databases and workflows will be able to rely on an A5 cell representing a specific geographic location into the future.
The community around the project has grown, in particular with the DuckDB and R implementations, whose beautiful sites arguably even put the official A5 site to shame! As such, going forward, the documentation on the A5 website will present code snippets and API documentation in these languages, as well as the officially supported TypeScript, Rust and Python libraries.
What's new
Compacted data processing
New in v1.0 is a whole new set of functions for working with collections of cells, known as coverings.
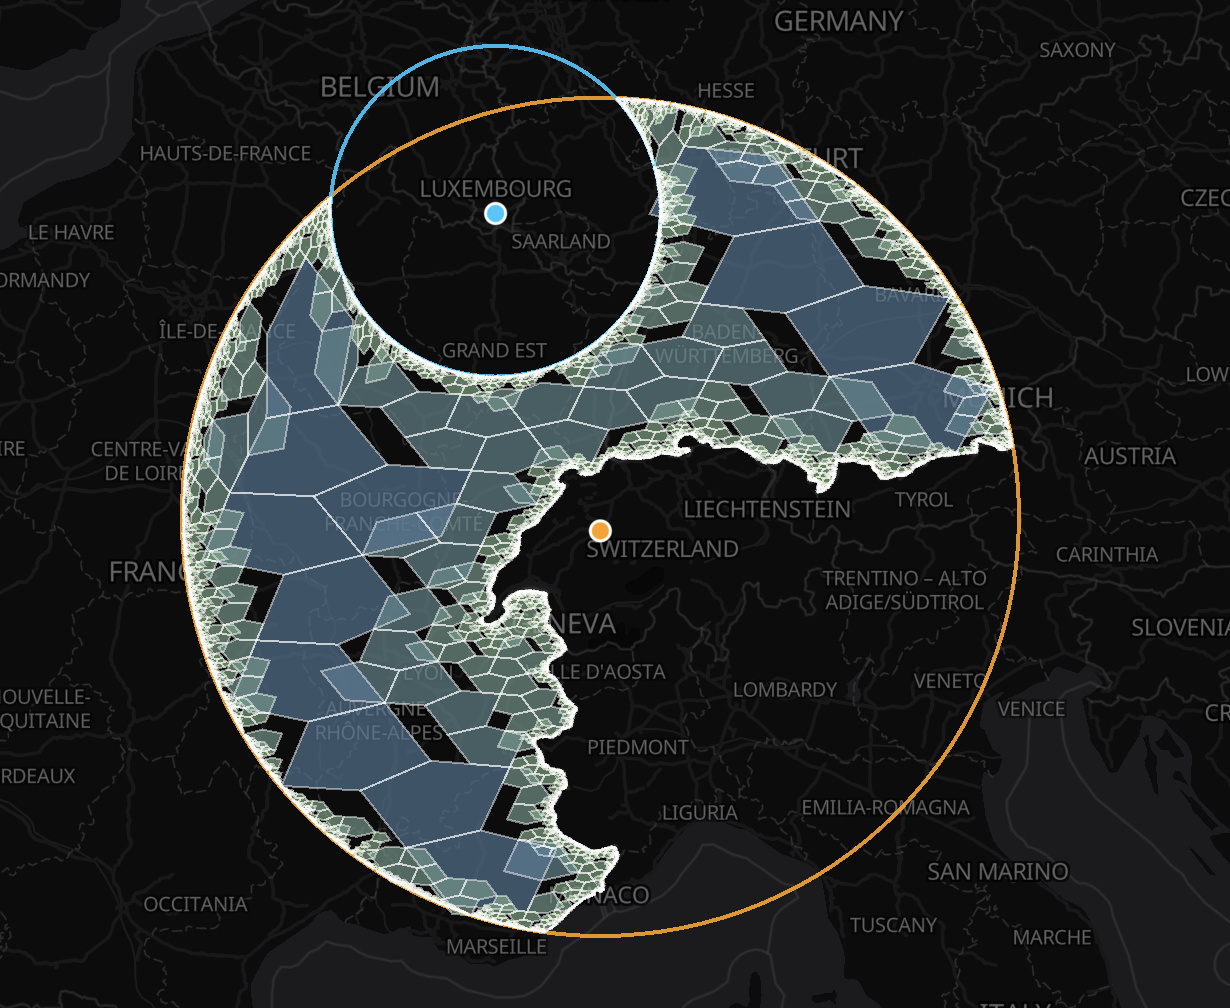
When working with coverings, you can now use set operations: union, intersect and difference, predicates: contains and overlaps and measuring functions: count and area.
By using compacted data and these operations, it is possible to process billions of cells efficiently without having to uncompact the data, as was necessary before. An example workflow might be to union several coverings from database queries, intersect with a polygon or spherical cap and then filter a collection of points against the resulting covering. See the example workflow.
Spatial hierarchy functions
Geometrically, it is impossible to split an A5 pentagon into more pentagons in such a manner that the result exactly overlaps; the same is true of hexagons - unlike quadrilaterals and triangles, which can be split exactly. The A5 hierarchy is thus logical, and only approximately spatial.
In order to support resampling and other operations, a new function cellToSubcells has been added. While this is slower than the cellToChildren API, it produces a correct covering (by centroid) of the cell. The inverse, cellToSupercell, is also available.
Equal area
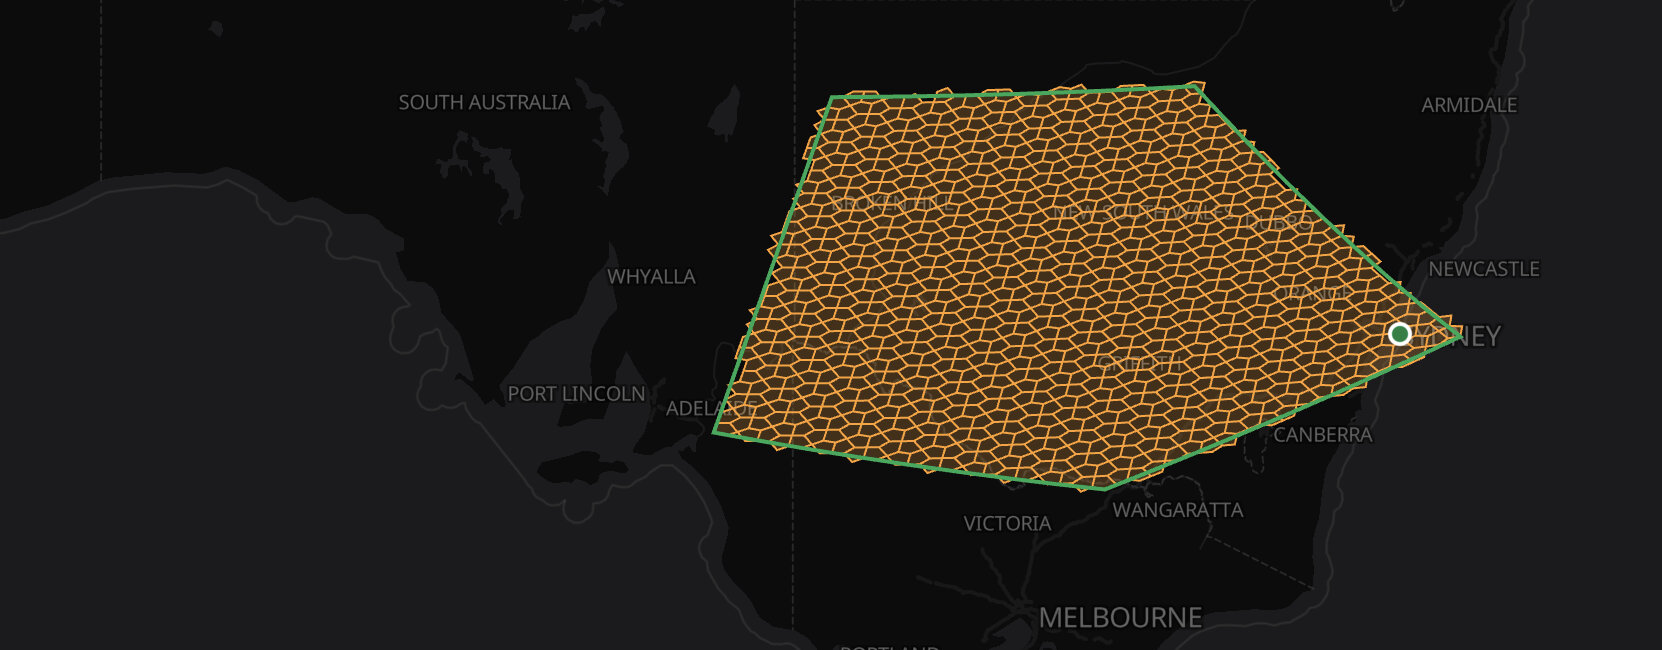
One of the key strengths of A5 has always been the guarantee that every cell is exactly the same area at a given resolution, which means that any analysis run using the system is free of bias due to unequal cell sizes. New in v1.0, all the cells at all resolutions have the same pentagonal topology. This is in contrast to hexagonal DGGSs, which must include 12 pentagonal cells that complicate the topology and break the pure equal-area guarantee.
Vibrant ecosystem
One of the important characteristics of a grid system is its support across a range of tools and software, both in industry and academia. By standardizing on a definition of the grid and cell identifiers, it is easy to move data between systems and applications. For example, the FIRMS Explorer above was built using:
- Geoparquet.io to aggregate the data:
gpio add a5 input.parquet output.parquet --resolution 5 - Portolan to host
- a5-js and the A5Layer in deck.gl to visualize
Along with a raft of implementations in popular systems, such as DuckDB, R, QGIS and more, it is easier to build and experiment with A5 than ever. If you would like to get involved, or just have a question - feel free to join the Slack channel!
Under the hood
Over the past 18 months, both A5's internals and its APIs have been refined.
Teohedral space-filling curve
The key change that the majority of the other improvements flow from is the implementation (and, well, discovery!) of a new teohedral space-filling curve, which defines the order in which the cells are indexed. The new curve passes around the whole world, without ever intersecting itself, while also grouping cells such that they form an (approximate) spatial hierarchy.
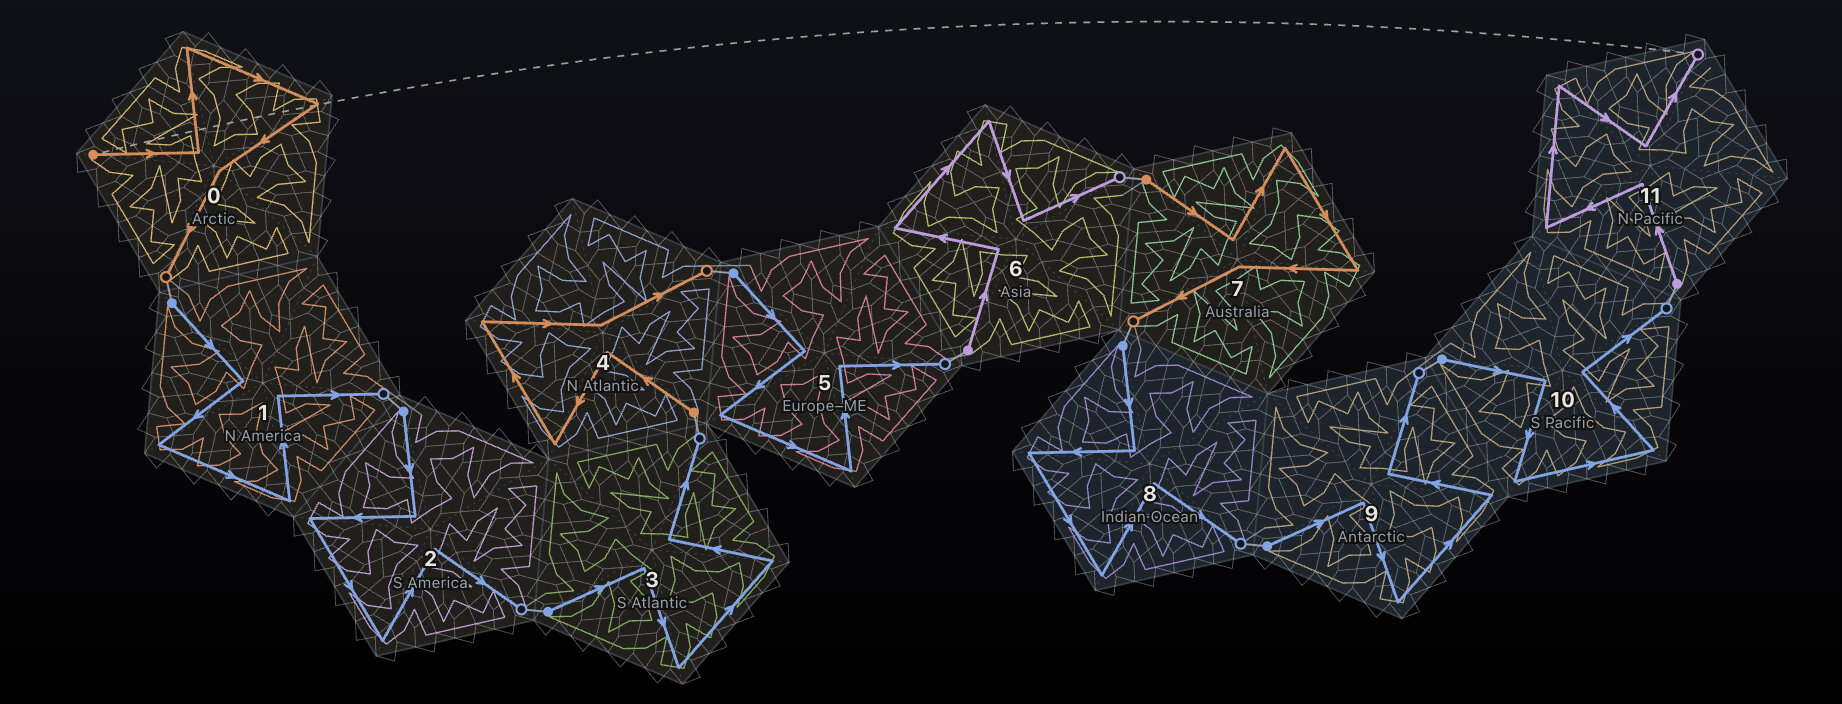
The fact that it doesn't self-intersect is crucial to some of the algorithms that can be built on top. For example, when filling a polygon with cells we can immediately deduce which cells are on the interior of the region without having to perform a costly flood fill. This works due to the boundary acting as a set of cutting points along the global space-filling curve - if we know these, then we can trivially fill in the cells in between.
The benchmarks below are instructive:
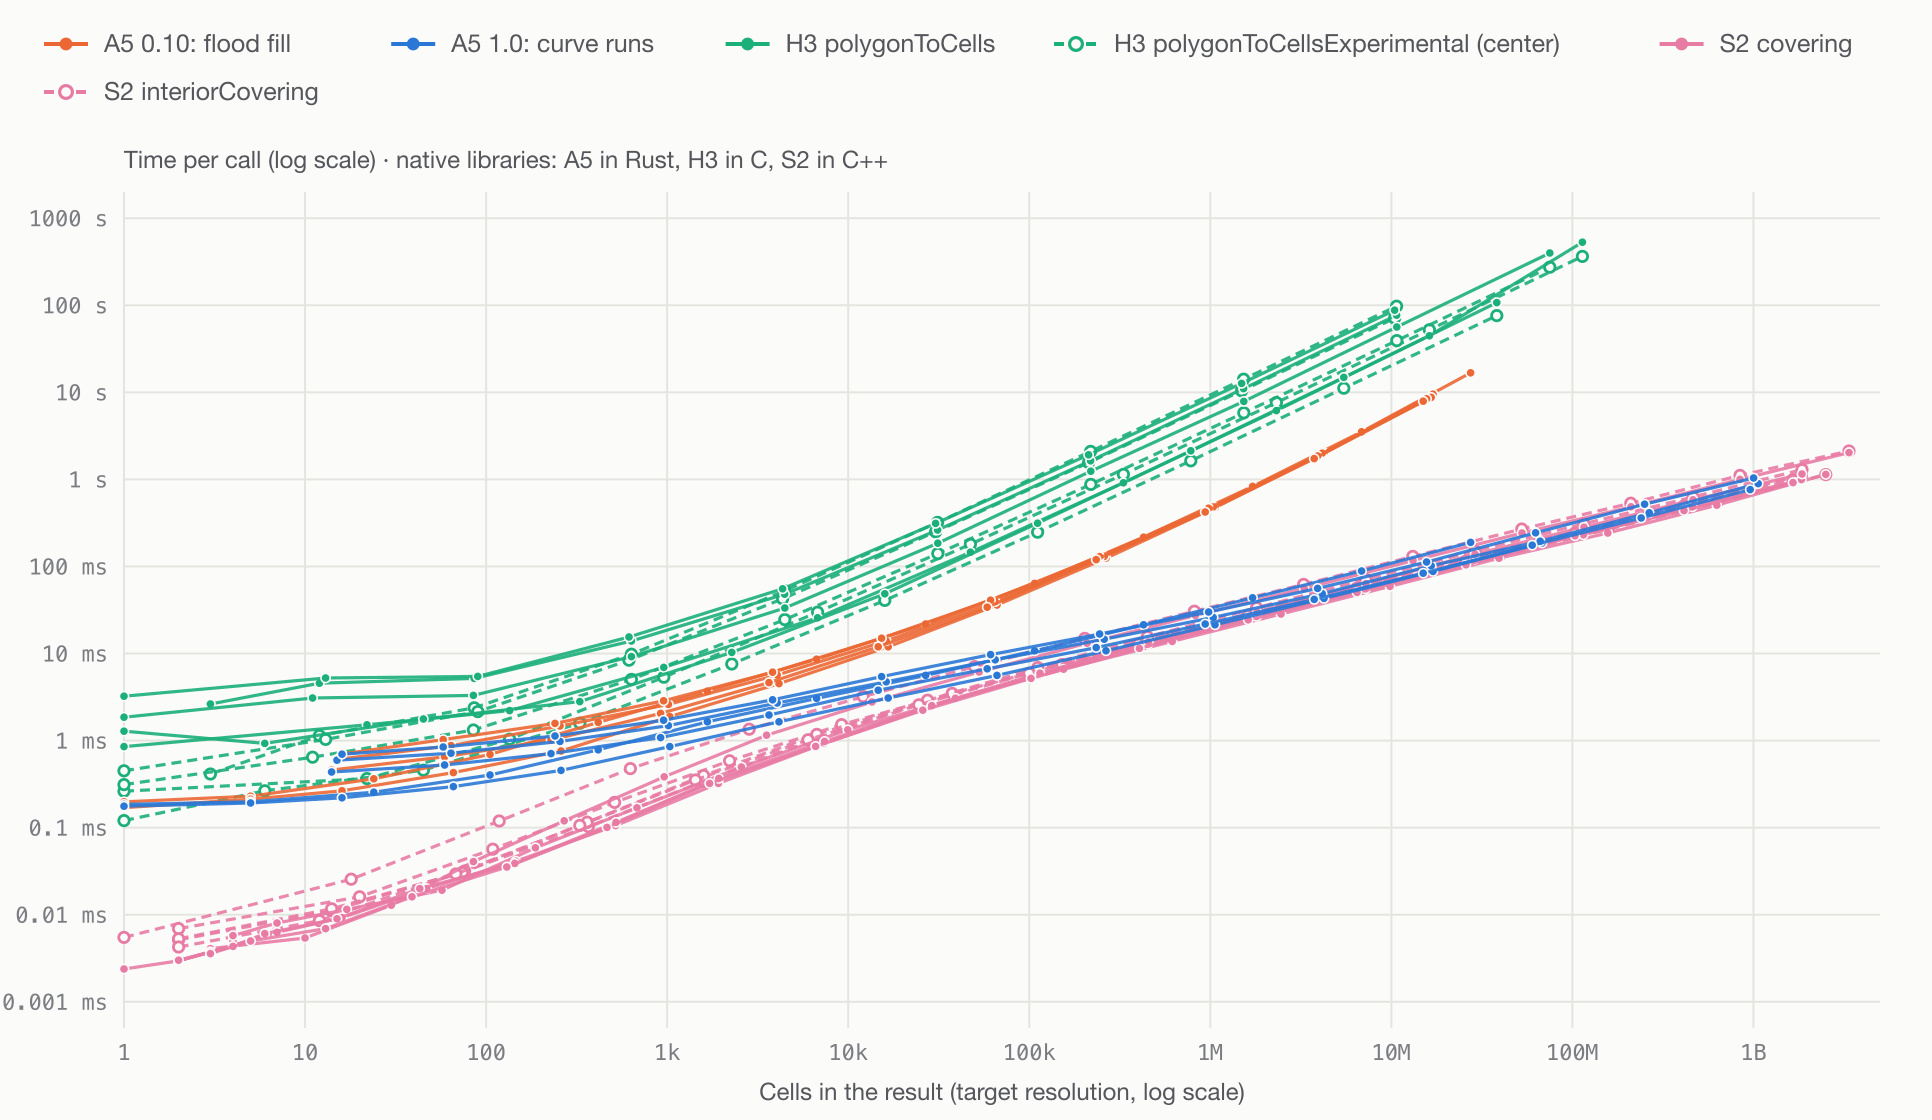
How these were measured: each point is one call filling a country outline (UK, France, Brazil, USA and Australia, from the A5 test fixtures) at one resolution, timed with the native libraries: A5 1.0.0 and 0.10.1 (Rust crates, rustc 1.87), H3 4.5.0 (the C library, via h3-py's NumPy API) and S2 (the C++ library, via the s2geometry 0.14.0 Python bindings; S2RegionCoverer with no cell limit, so it returns a compacted covering at the target level). Times are the fastest of repeated runs, or a single run for calls over 2 seconds, on an Apple M1 Pro. Each library was stopped once a call took longer than a minute (6 seconds for A5), or past a billion cells.
Prior to v1, A5 polygon fills became impractically slow beyond a million cells. The same is true of H3 today. By contrast, S2 is able to handle up to a billion cells without any issues, as is the new version of A5. It is no coincidence that S2 also uses a space-filling curve (Hilbert) which doesn't self-intersect, while H3 index order has no such property.
Similar algorithmic tricks can be used to speed up other operations, like intersections or area counts. For an interactive example of these operations, see the Coverings example.
Cell IDs
A necessary consequence of changing the curve is that the cell IDs change. See the Upgrade Guide for migration instructions.
Thanks & looking forward
It has been a challenge and a lot of fun to work on A5, and it has led to some great conversations with many smart people. A big thank you to all the people who have got involved, by building libraries on top of A5, reporting bugs or just spreading the word.
I find the topic fascinating. I hope you find A5 useful in your work, and that the examples on the site help show how a DGGS is put together. I am currently working (with a few others) on a paper which will explain the design of A5 more rigorously as well as provide comparisons to other DGGS libraries.
If you would like to get involved, join us on our Slack channel, and if you build anything with A5, please share!